- Build
- Experiment
- Started
- Jun 2026
- Updated
- Oct 2026
- Built with
- ES modulesCanvas 2DCloudflare WorkersOpenStreetMap data
- Lives at
- sectors.anirudhgoel.xyz
- Sectors on the map
- 55
- Places, each a room
- 15
- Sources behind the facts
- About 500
- Chowks drawn
- 71
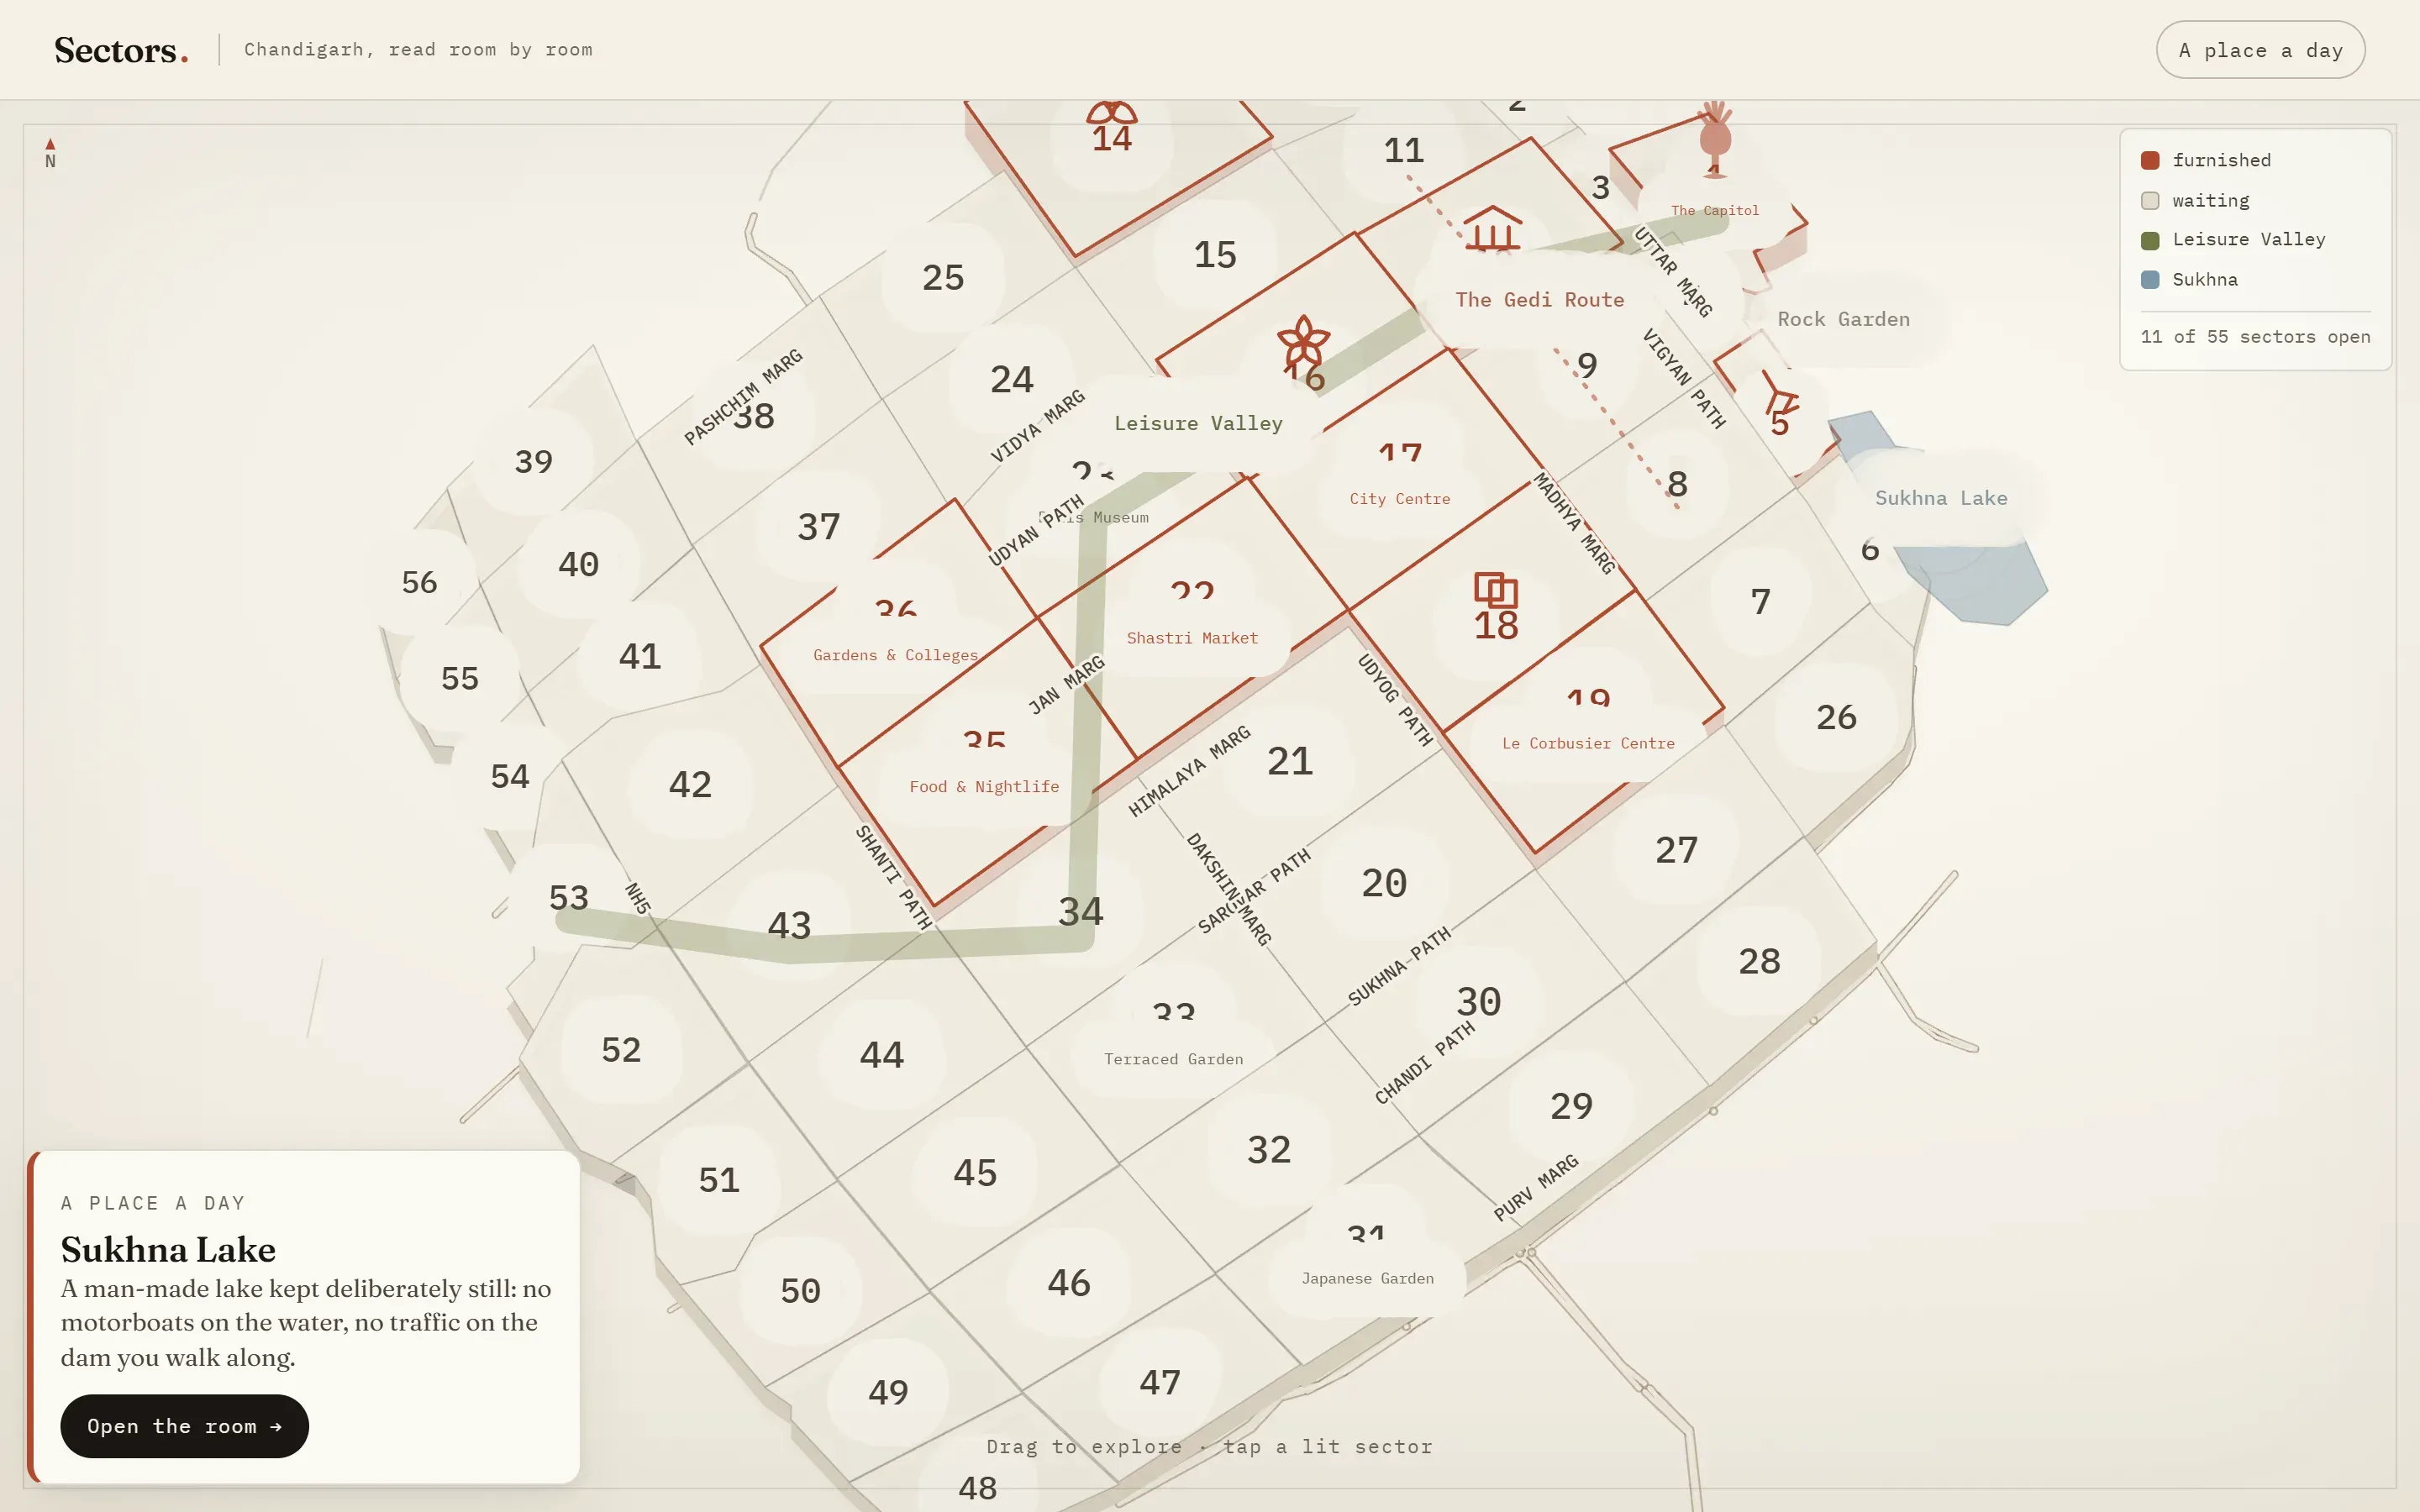
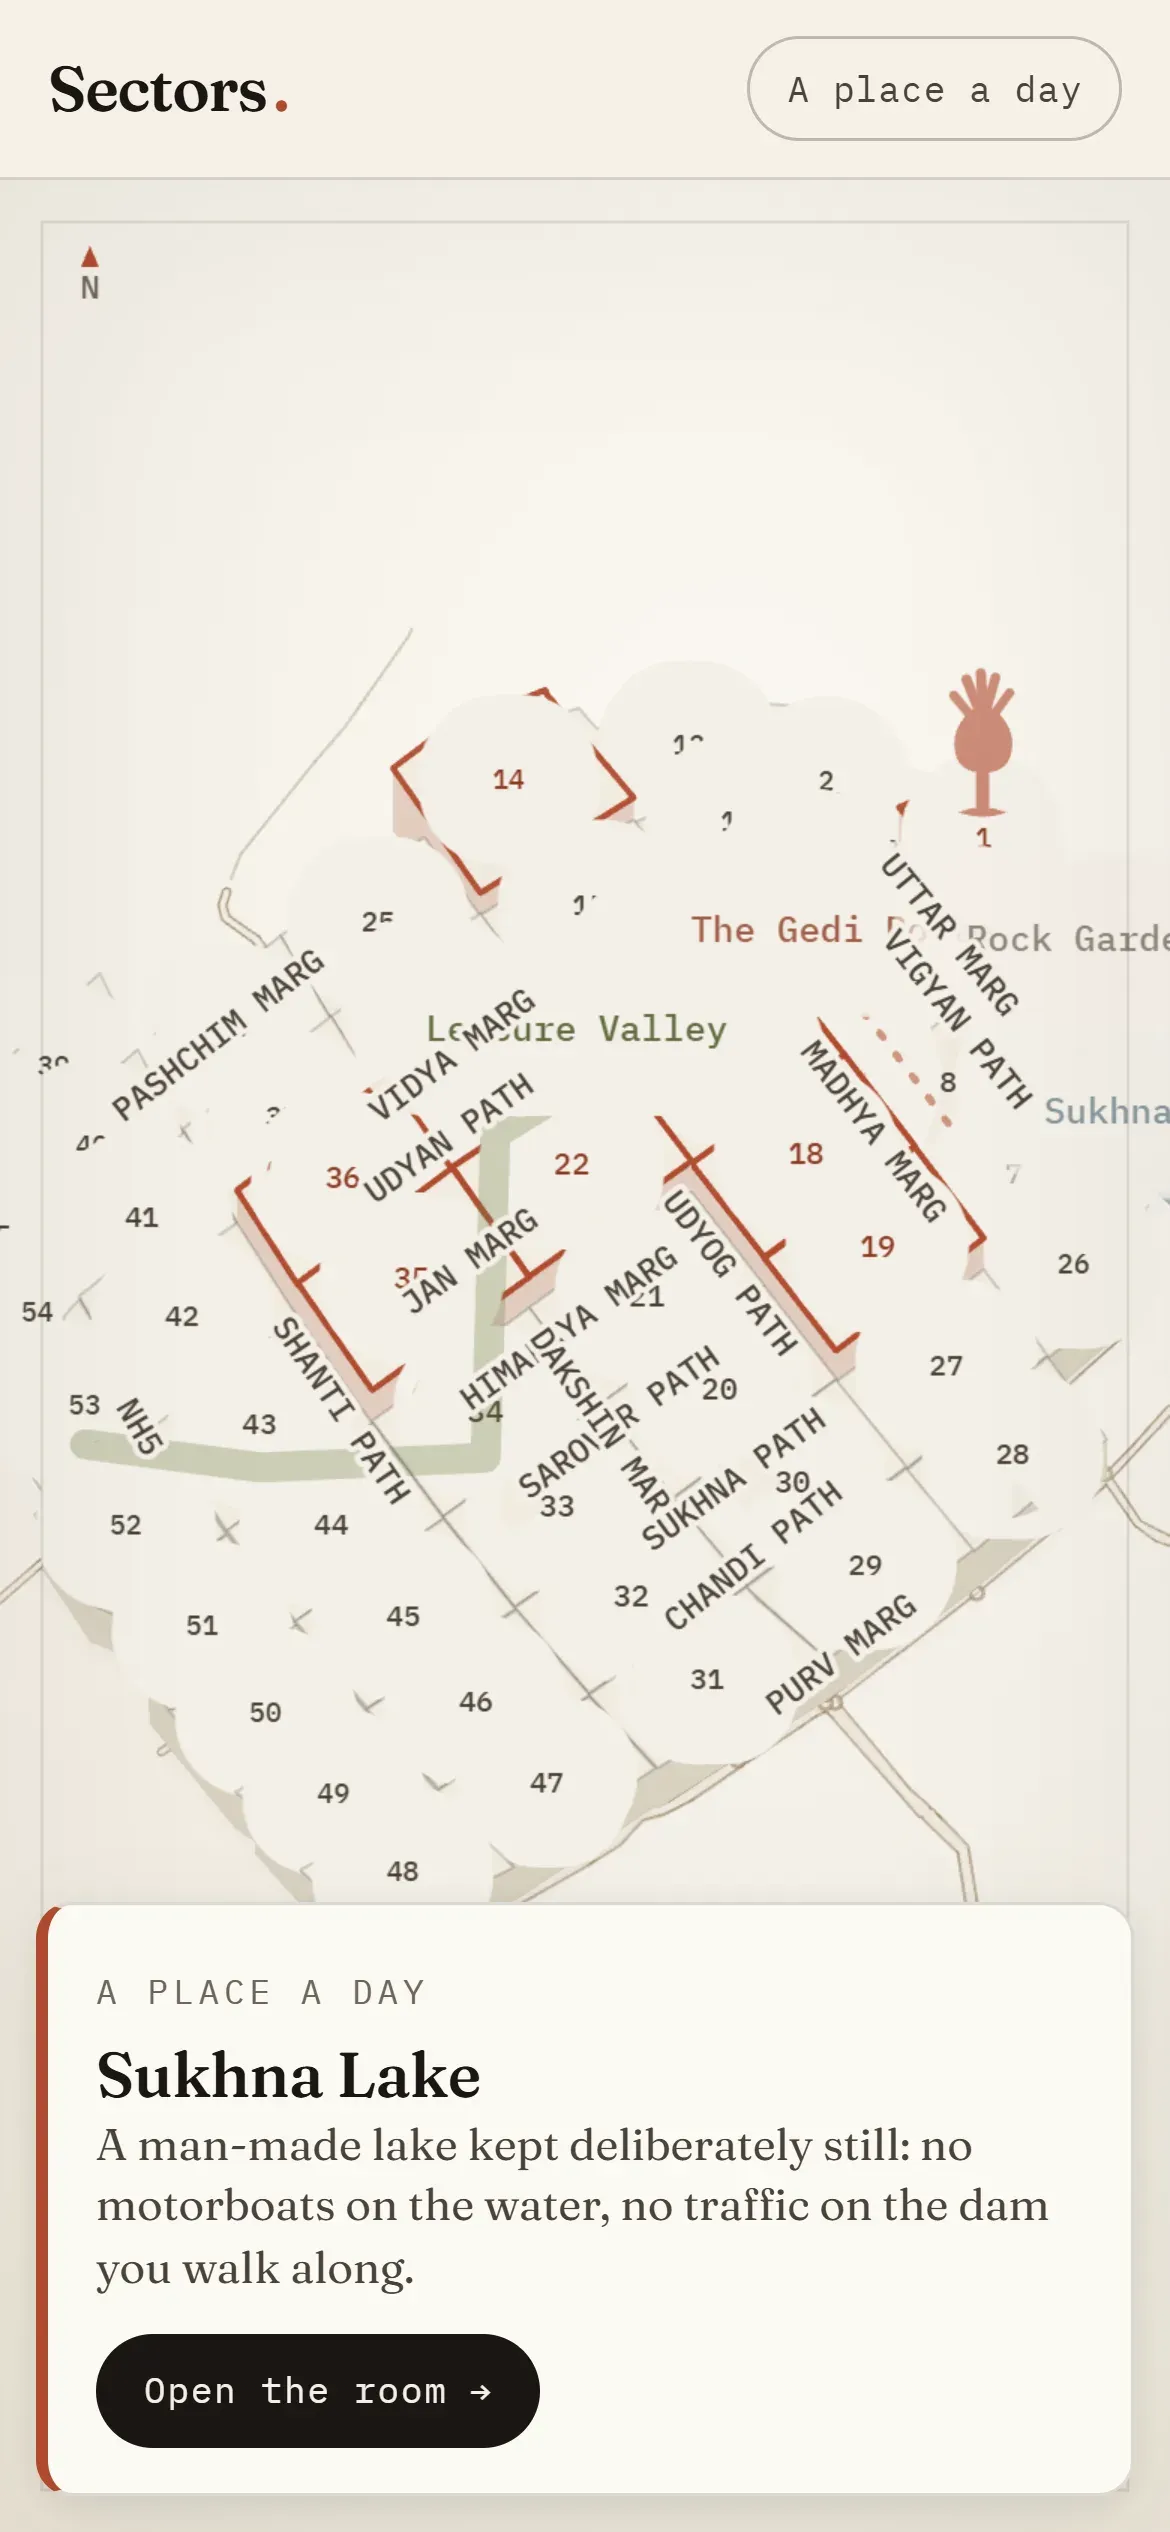
You read Chandigarh the way the city is built: sector by sector. The map is the real grid, drawn as raised concrete plates, with the roads, the named margs and the chowks where they actually are. A place a day picks one for the front of the atlas.
Rooms, with sources
Fifteen places are furnished as rooms. Each has its story, a then and now, a local tip and a source on every fact, about 500 sources in all. Pictures wait for my own photos: Le Corbusier’s image rights run to 2036, and India has no freedom of panorama.
Real data
The sector shapes come from datameet’s Municipal Spatial Data (CC BY 4.0) and the roads from OpenStreetMap (ODbL). The look is a paper atlas: warm paper, carbon ink and one brick-red accent.